Viewing Device Status on Monitor Page
The Web interface's Monitor page provides basic status and information on the device. The page is useful in that it allows you to easily obtain an overview of the device's operating status at a glance.
| ➢ | To view device status and information on the Monitor home page: |
| ■ | On the Menu bar, click Monitor or if you are already in the Monitor menu's Navigation tree, click |
The Monitor page displays the following groups of information:
| ■ | Device Information: |
| ● | Address: IP address of the device's OAMP interface |
| ● | Firmware: Software version currently running on the device |
| ● | Type: Name of the device |
| ● | S/N: Serial number of the device. |
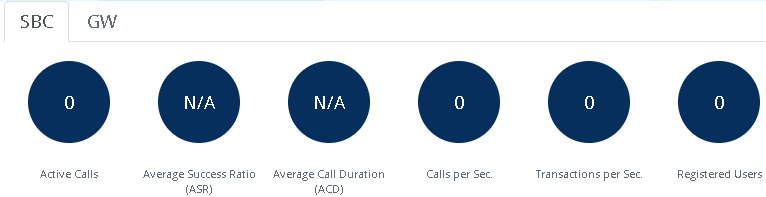
| ■ | SBC Call Statistics: |
| ● | Active Calls: Total number of SBC calls. The corresponding SNMP performance monitoring MIB is PM_gwINVITEDialogs. |
| ● | Average Success Rate (ASR): Number of successfully answered calls out of the total number of attempted calls. The corresponding SNMP performance monitoring MIB is PM_gwSBCASR. |
| ● | Average Call Duration (ACD): Average call duration in seconds of established calls. The value is refreshed every 15 minutes and therefore, this value reflects the average duration of all established calls made within a 15 minute period. The corresponding SNMP performance monitoring MIB is PM_gwSBCACD. |
| ● | Calls per Sec: Total number of new calls per second (CPS). |
| ● | Transactions per Sec: Total number of new SIP transactions per second (out-of-dialog transactions such as INVITE and REGISTER, or in-dialog transactions such as UPDATE and BYE). The corresponding SNMP performance monitoring MIB is PM_gwActiveSIPTransacionsPerSecond. |
| ● | Registered Users: Number of users registered with the device. The corresponding SNMP performance monitoring MIB is acPMSBCRegisteredUsersTable. |
SBC
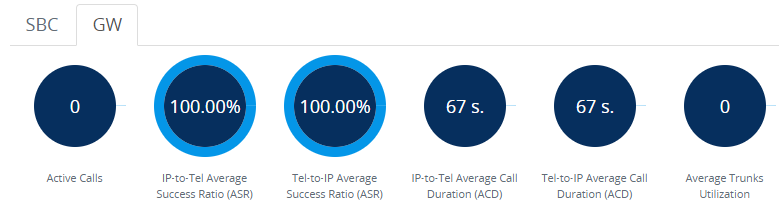
| ■ | Gateway Call Statistics: |
| ❖ | Active Calls: Total number of Gateway calls. The corresponding SNMP performance monitoring MIB is PM_ActiveContextCount. |
| ❖ | IP-to-Tel Average Success Ratio (ASR): The corresponding SNMP performance monitoring MIB is PM_gwAttemptedCalls. |
| ❖ | Tel-to-IP Average Success Ratio (ASR): Number of successfully answered Tel-to-IP calls out of the total number of attempted calls. The corresponding SNMP performance monitoring MIB is PM_gwAttemptedCalls / PM_gwEstablishedCalls. |
| ❖ | IP-to-Tel Average Call Duration (ACD): Average call duration in seconds of established IP-to-Tel calls. The value is refreshed every 15 minutes and therefore, this value reflects the average duration of all established calls made within a 15 minute period. The corresponding SNMP performance monitoring MIB is PM_gwCallDuration. |
| ❖ | Tel-to-IP Average Call Duration (ACD): Average call duration in seconds of established Tel-to-IP calls. The value is refreshed every 15 minutes and therefore, this value reflects the average duration of all established calls made within a 15 minute period. The corresponding SNMP performance monitoring MIB is PM_gwCallDuration. |
| ❖ | Average Trunks Utilization: Average number of trunks currently in use (busy). The corresponding SNMP performance monitoring MIB is PM_TrunkUtilization. |
| ■ | Graphical Display of device: Shows color-coded status icons, as shown in the figure below and described in the subsequent table: |
Graphical Display of Device (Example) on Monitor Page - Mediant 500 Multi-Service Business Router (MSBR)
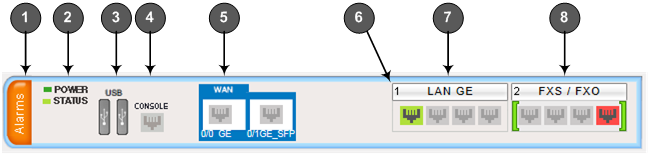
| ● | The figure above is used only as an example as the graphical display of your device in the Web interface reflects your specific ordered hardware configuration. |
Description of Graphical Display of Device on Monitor Page
|
Item #1 |
Description |
||||||||||||||||||||||||||||||||||||||||||||||||||||||
|---|---|---|---|---|---|---|---|---|---|---|---|---|---|---|---|---|---|---|---|---|---|---|---|---|---|---|---|---|---|---|---|---|---|---|---|---|---|---|---|---|---|---|---|---|---|---|---|---|---|---|---|---|---|---|---|
|
1 |
Alarms: Displays the highest severity of an active alarm raised (if any) by the device:
To view active alarms, click Alarms to open the Active Alarms page (see Viewing Active Alarms). |
||||||||||||||||||||||||||||||||||||||||||||||||||||||
|
2 |
STATUS LED icon displaying operating status. |
||||||||||||||||||||||||||||||||||||||||||||||||||||||
|
3 |
USB ports for 3G cellular WAN modem (primary or backup WAN) or USB storage services:
|
||||||||||||||||||||||||||||||||||||||||||||||||||||||
|
4 |
RS-232 interface port. |
||||||||||||||||||||||||||||||||||||||||||||||||||||||
|
5 |
WAN port status icons:
Depending on ordered hardware configuration, the WAN port can be Gigabit Ethernet copper, SHDSL, ADSL2+ / VDSL2, or SFP fiber optic. |
||||||||||||||||||||||||||||||||||||||||||||||||||||||
|
6 |
Module number. |
||||||||||||||||||||||||||||||||||||||||||||||||||||||
|
7 |
Ethernet port status icons:
To view detailed port information, click the port icon to open the Network View page (see Viewing WAN and LAN Port Information ). If the ports are enabled with Power-over-Ethernet (PoE), the color codes of the status icons are as follows:
|
||||||||||||||||||||||||||||||||||||||||||||||||||||||
|
8 |
Port analog channel status icon:
The port is physically connected to an FXS analog device (e.g., telephone), which is in idle state (i.e., on-hook position). -or- The port is not physically connected.
The port is not physically connected. -or- If the port is physically connected to an FXS analog device, it is out-of-service due to Serial Peripheral Interface (SPI) failure.
Port trunk status icon:
If you click a port, a shortcut menu appears with commands allowing you to do the following:
|
 (green): Link is working
 (gray): Link is not configured
 (red): Link error
 (gray with dark gray frame): Link is not connected.
 (green with dark gray frame): Ethernet delivered.
 (gray with orange frame): Power delivered.
 (green with orange) Ethernet and power deliver
 (blue): The FXS or FXO port is physically connected to an analog device which is in off-hook state, but no established call.
 (yellow): The trunk has a Remote Alarm Indication (RAI), also known as the Yellow Alarm.
 (orange): The trunk has a D-channel alarm.
 (dark orange): The trunk has an NFAS alarm.